How to Read a Crypto Price Chart
Risk Disclaimer — Please Read First: Cryptocurrency is volatile. Prices can rise and fall sharply, sometimes within hours, and you can lose everything you put in. Nothing in this article is financial advice, and no chart pattern can predict or guarantee a future price.
How to Read a Crypto Price Chart: Candlesticks, Support and Resistance for Beginners
Open any exchange app and the first thing you meet is a chart covered in green and red bars. It looks like a language only traders speak. It is not — a price chart is just a picture of what buyers and sellers have already done, drawn in a standard way. Learning to read it will not tell you what happens next, and anyone who claims otherwise is selling something. What it will do is stop the chart from intimidating you, and help you understand what other people in the market are looking at.
This guide assumes you know roughly what the asset is. If terms like BTC are still fuzzy, read our beginner’s guide to Bitcoin first, then come back here.
The Four Numbers Behind Every Chart
Every chart, however decorated, is built from the same raw material. For any period — say, one hour — the market produces four prices:
- Open: the price at the start of the period
- High: the highest price reached during it
- Low: the lowest price reached during it
- Close: the price at the end of it
Add volume — how much actually changed hands — and you have everything a standard chart shows. Candlesticks are simply a compact way of drawing those four prices at once. The general method comes from technical analysis, whose history and main ideas are summarised in the technical analysis overview on Wikipedia.
Anatomy of a Candlestick
Each candle covers one period, and its colour tells the story of that period:
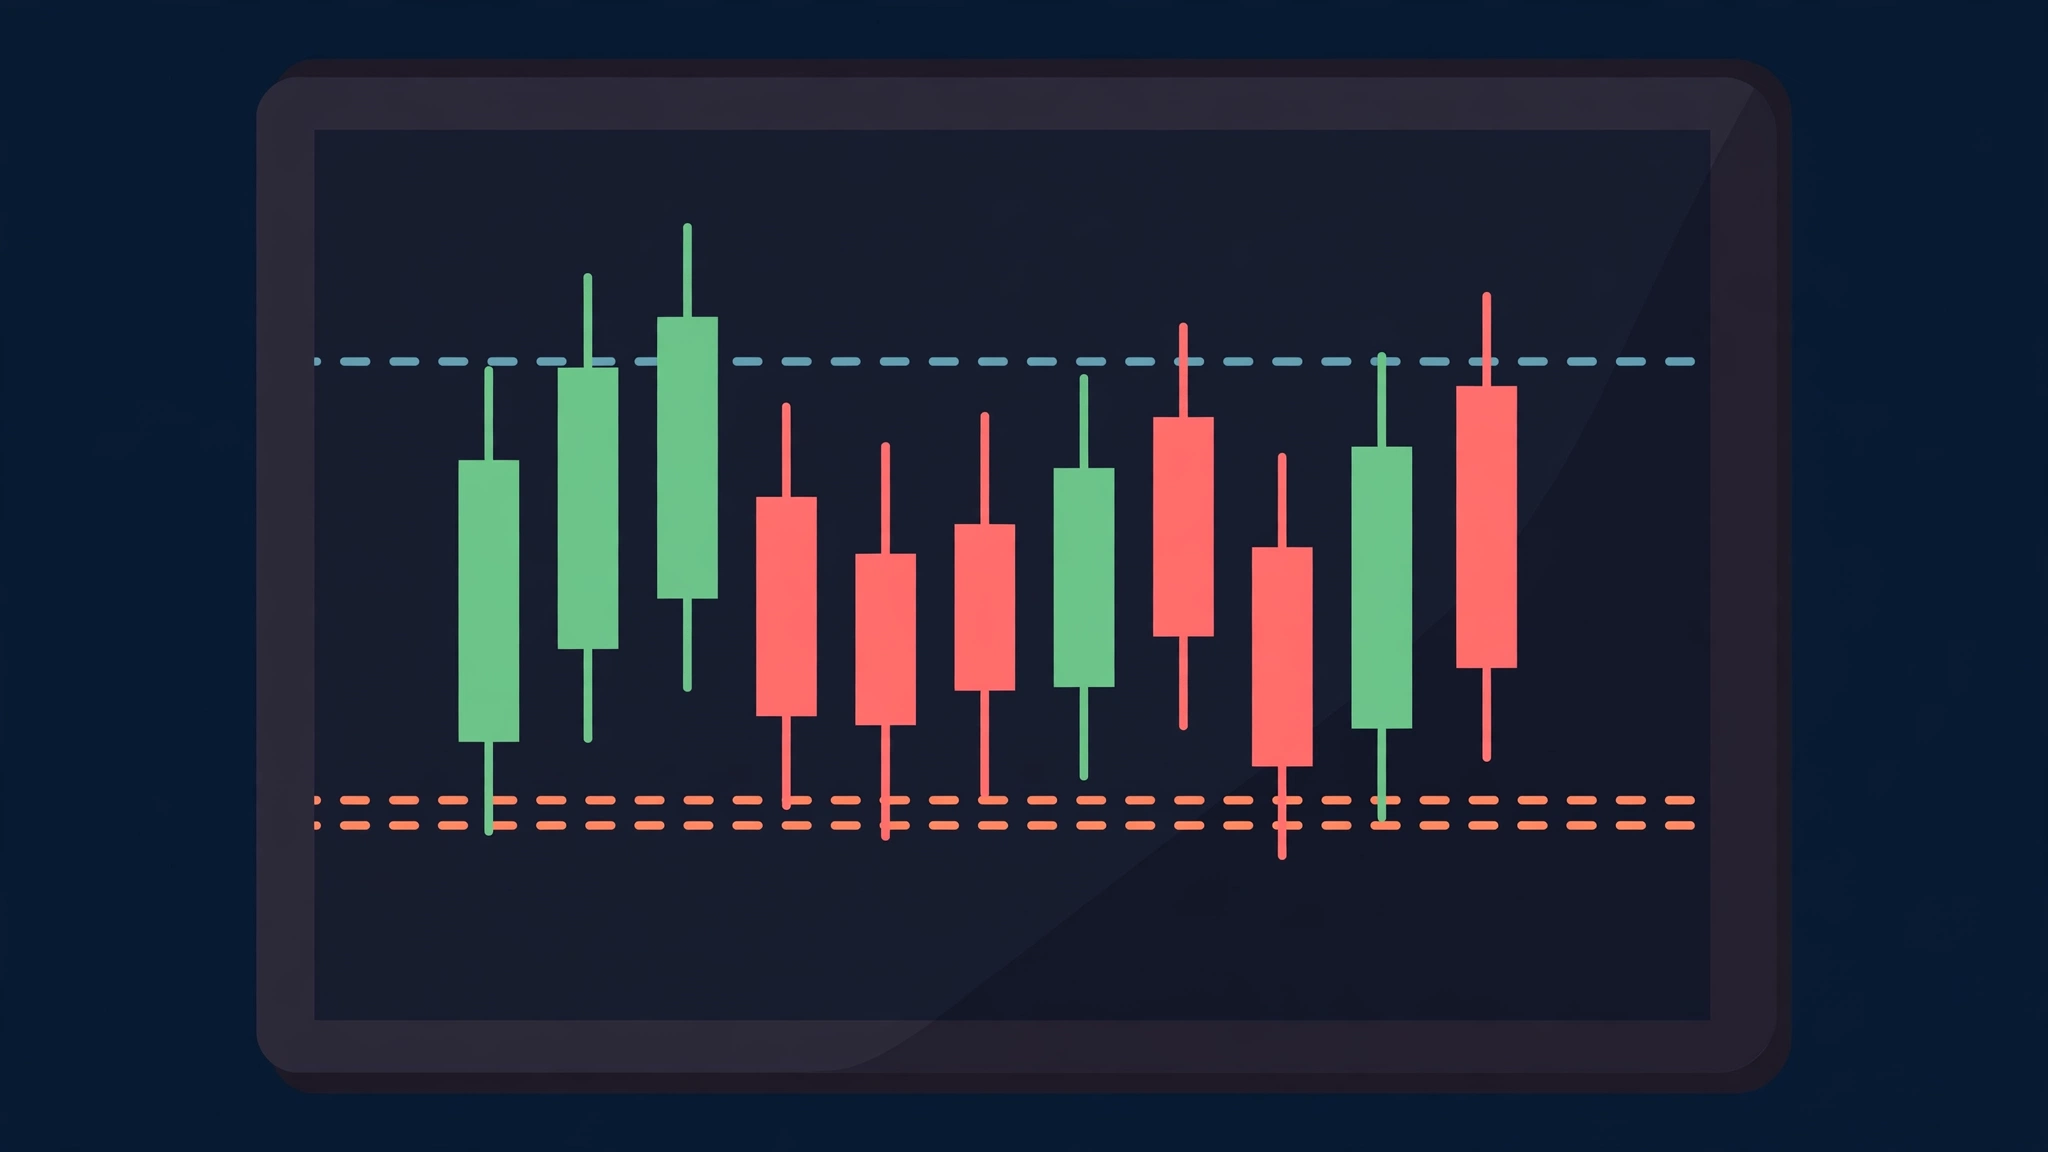
- A green (or white) candle means the price closed higher than it opened. Buyers finished the period on top.
- A red (or black) candle means the price closed lower than it opened. Sellers finished on top.
The thick part is the body, stretching from open to close. The thin lines above and below are the wicks (or shadows), reaching out to the high and the low.
Reading a few shapes becomes second nature quickly. A long green body with short wicks means steady buying from start to finish. A tiny body with a very long upper wick means price was pushed up and then beaten back down within the same period — enthusiasm that failed. One candle proves nothing on its own; traders read them in sequences, the way you read words in a sentence rather than single letters.
Timeframes: The Same Market at Different Zoom Levels
A candle means nothing until you know what period it represents. Charts let you choose: 1 minute, 15 minutes, 1 hour, 4 hours, 1 day, 1 week. The market looks completely different at each zoom — a frightening crash on the 15-minute chart can be an invisible wiggle on the weekly one.
Practical guidance for beginners:
- Match the timeframe to your question. Judging a purchase you plan to hold for months on a 5-minute chart is like judging a road trip by one speed-bump.
- Look at two timeframes. Check the daily chart for the overall direction, then a shorter one for detail. If they disagree, the larger timeframe deserves more respect.
- Beware very short timeframes. Minute charts are mostly noise, and crypto’s round-the-clock trading makes them noisier still.
Support and Resistance: Floors and Ceilings Price Remembers
Draw enough charts and you notice prices often stall or bounce at the same levels repeatedly. Those levels get names:
Support is a price area where falls have repeatedly slowed or reversed — a floor where buyers have historically shown up. Resistance is the opposite: a ceiling where rises keep stalling as sellers appear.
Why do they work at all? Partly memory and psychology. People who bought at a level and watched it fall wait to sell when price returns there; people who missed buying at a low vow to buy if it comes back. Enough orders cluster at a remembered level and the level becomes real — until it doesn’t.
That last part matters. Support and resistance are zones, not laws. When a floor finally breaks with heavy volume, it often flips roles and becomes the new ceiling, and vice versa. Treat them as “areas where something has happened before”, never as guarantees. Even the much steadier assets covered in our stablecoins guide show this behaviour in miniature around their peg — levels are about crowd behaviour, not about the asset.
Volume: The Chart’s Honesty Check
Volume bars sit along the bottom of most charts, one per candle, showing how much was traded in that period. Traders lean on it for a simple reason: a price move on heavy volume involved many participants and is taken more seriously than the same move on a trickle of trades.
Two beginner-level uses are enough. A breakout through resistance on rising volume is more convincing than one on fading volume. And a dramatic candle on suspiciously low volume — common on small, obscure coins — should be treated as fragile, possibly even manufactured by a handful of wallets. It is also why wallet security belongs in the same conversation as charts: the busiest phishing lures are fake charting and trading pages, a risk we cover in our crypto wallets safety guide.
What Charts Cannot Do
This is the section the hype accounts skip.
Charts describe the past. Every candle is history. Patterns look obvious looking backwards; in real time, the same shape regularly fails, because the future is not obliged to rhyme.
Crypto is a hostile charting environment. Markets run 24/7, many coins trade thinly, prices can gap violently on a single headline, and manipulation of small coins is well documented. Clean textbook patterns appear less often than social media suggests — nobody posts the forty times the pattern failed.
Indicators do not fix this. Moving averages, RSI and the rest are just arithmetic on the same past prices. They can organise what you see; they cannot add information that is not already in the price and volume. Stacking ten of them produces confidence, not knowledge.
Use charts the honest way: to understand what has happened, to see where crowds reacted before, and to define in advance what would prove your idea wrong. That is a tool. A crystal ball is not on offer.
Frequently Asked Questions
Which timeframe should a beginner start with?
The daily chart. One candle per day filters out most noise, shows the real trend, and matches the pace at which a beginner should be making decisions — slowly.
What does a long wick mean?
A long upper wick means price rose during the period but was pushed back down before it ended — sellers rejected the higher price. A long lower wick is the mirror image: a dip that buyers rejected. Context decides whether it matters.
Are support and resistance real or superstition?
They are real in the limited sense that many traders watch the same levels and place orders there, which can make the levels behave as expected — for a while. They break regularly, and a strategy that treats them as unbreakable will eventually be hurt by one.
Do professional traders rely only on charts?
No. Professionals combine price information with market structure, news, liquidity and risk rules, and many do not use chart patterns at all. What they share is not a secret pattern — it is strict control of how much they can lose on any single idea.
Can I practise reading charts without real money?
Yes, and you should. Every major charting platform lets you scroll back through history and test whether you would have read it correctly, and exchanges offer demo modes. Practise on history first; the market charges full price for lessons learned live.
Conclusion
A crypto chart is four prices and a volume count, drawn as candles, at whatever zoom you choose. Learn the candle anatomy, respect timeframes, mark the floors and ceilings where price reacted before, and check volume before believing any move. Then remember the limit: charts explain the crowd’s past, never its future. Read them to stay oriented, not to feel certain — and explore the rest of the Crypto guides on Stylish Namees to build the knowledge around the chart.